
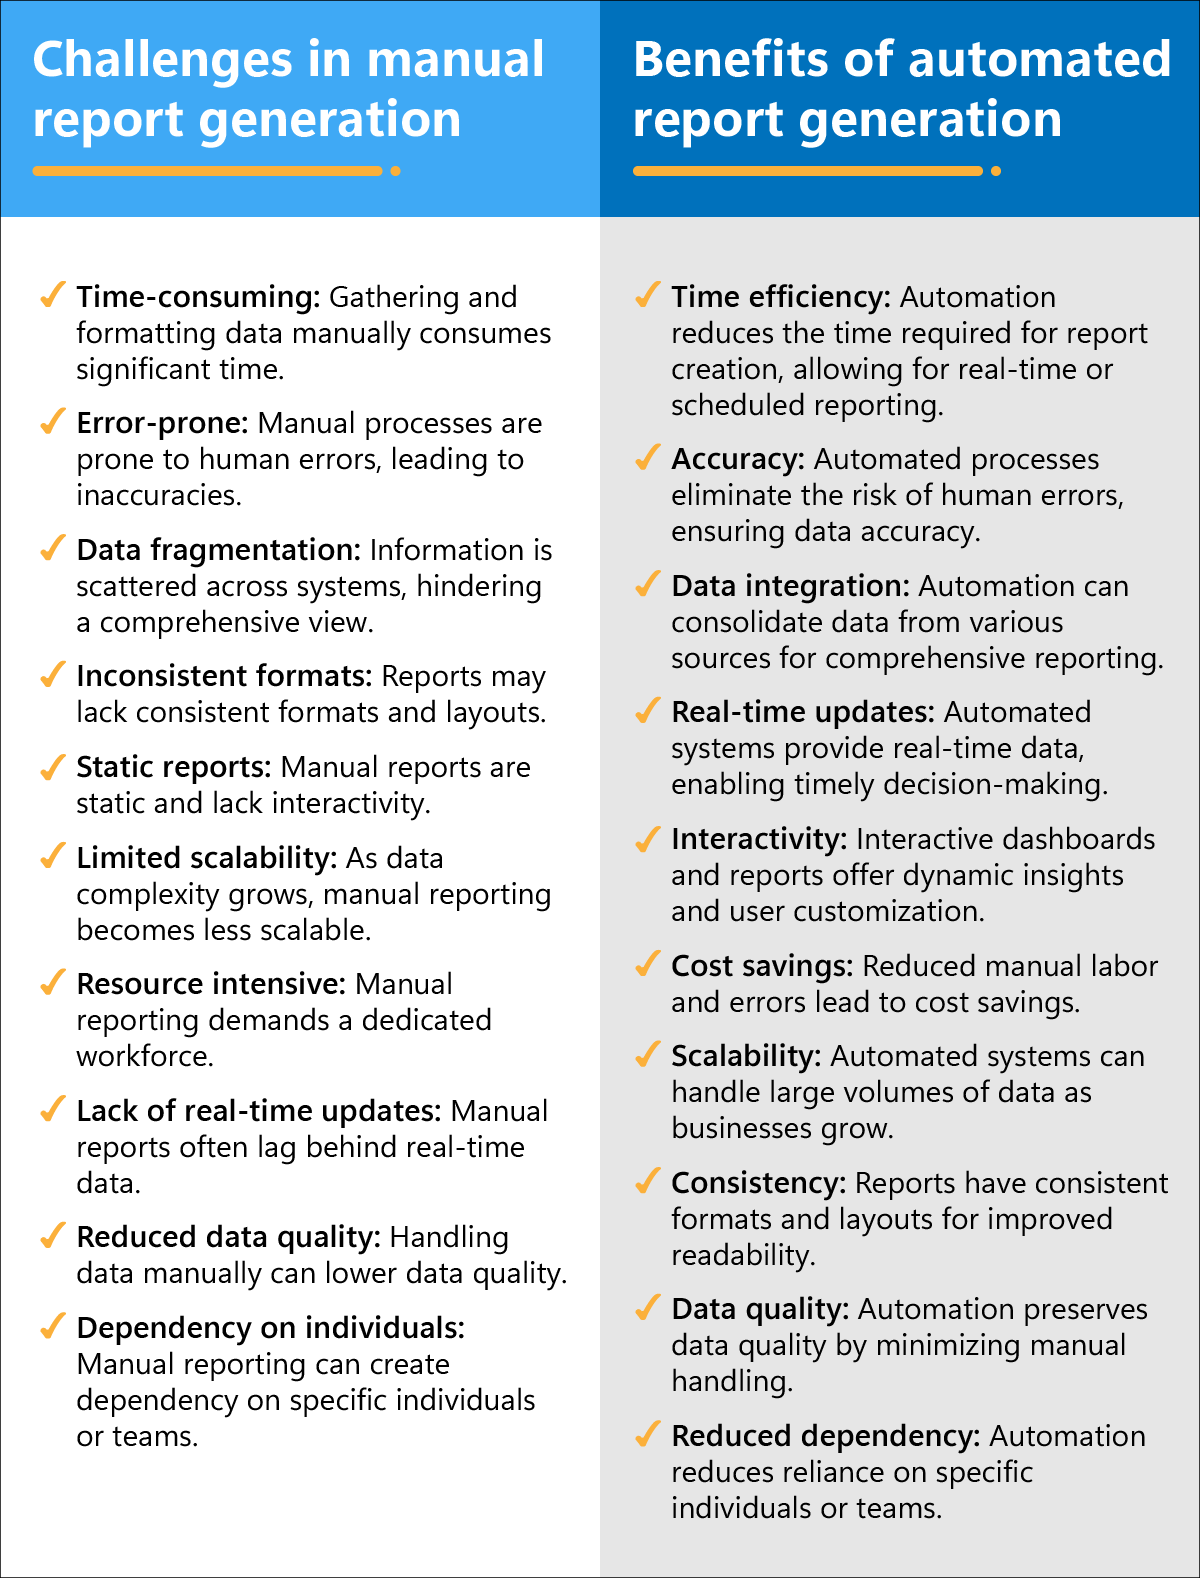
Imagine you’re the manager of a rapidly growing e-commerce business. Every week, your team manually compiles sales reports to assess the performance of different product categories, marketing campaigns, and regions. The process is not only time-consuming but also prone to human errors.
Now, suppose you launched a massive marketing campaign. You may need immediate insights to optimize it further. However, the manual report generation process takes a few days, causing a delay in assessing the campaign’s impact. By the time the reports are ready, the campaign’s peak period has passed, and you’ve missed a valuable opportunity to adjust your strategy in real-time. Therefore, automated report generation is needed.
With this system in place, you’d receive real-time reports with up-to-the-minute data on product sales, campaign performance, and regional trends.
This automation would allow you to make immediate adjustments, shift marketing budgets, change product promotions, or redirect efforts to the most profitable areas.
Automated report generation not only saves time and reduces errors but also ensures that your business remains agile and responsive to market dynamics.
It empowers you to make data-driven decisions in real-time, staying ahead of the competition and capitalizing on opportunities as they arise.
Let’s see how to automate report generation with AI. Here’s a step-by-step guide for it.
Step 1: Data Integration
Let’s say you manage a large e-commerce platform. Your data sources are spread across multiple systems – sales data in one database, customer data in another, and inventory data in yet another. Here’s how you can integrate them:
- Connect AI tools to data sources: Use AI-driven data integration tools like Talend, Informatica, or custom scripts with APIs to establish connections with your different databases. These tools facilitate the automatic retrieval of data from each source, ensuring a seamless flow of information to the next steps.
Step 2: Template creation
You want to generate a weekly sales report that includes information on total sales, top-selling products, and customer demographics. Here’s how to create templates:
- Design report templates: Develop report templates with placeholders for the data. In the case of your e-commerce business, your template might have sections for total sales figures, product details, and customer insights. These templates serve as blueprints for your reports.
Step 3: Data processing
To populate your report template with real data, you need to perform various calculations and analyses. Let’s look at this in detail:
- Automate data processing: AI algorithms come into play here. They extract and process data from your integrated sources. For instance, these algorithms calculate total sales, identify top-selling products based on sales data, and analyze customer demographics. These processes are automated, ensuring that your reports are always based on the latest data.
Step 4: Automation rules
Now, you want to ensure that reports are generated at specific times or when certain criteria are met. Here’s how:
- Set rules for report generation: Configure your AI system to generate reports according to your schedule and criteria. For instance, you can schedule the sales report to be generated every Monday morning. You specify the date range and other criteria to ensure that the right data is included in your report.
Step 5: Review and validation
Before sharing your reports with stakeholders, it’s essential to ensure their accuracy. Here’s how you can do this:
- Implement validation checks: Create validation checks using AI algorithms. These checks verify the accuracy of your data and report content. For example, algorithms can be set up to flag any discrepancies or anomalies in the data, ensuring that your reports are reliable and free from errors.
This code snippet uses the Isolation Forest algorithm from the scikit-learn library as a simple example of anomaly detection.
| import numpy as np from sklearn.ensemble import IsolationForest # Generate sample data (replace this with your real data source) data = np.random.randn(1000, 2) # Sample data with two features # Initialize the Isolation Forest model model = IsolationForest(contamination=0.1) # You can adjust the contamination parameter # Fit the model to your data model.fit(data) # Predict anomalies in the data anomalies = model.predict(data) # Anomalies will be labeled as -1, while inliers (normal data points) will be labeled as 1 # You can use these predictions to flag discrepancies or anomalies in your data # For instance, you can identify and count anomalies num_anomalies = np.sum(anomalies == -1) # Depending on the number of anomalies or their severity, you can take appropriate actions in your report validation process if num_anomalies > 0: print(f”Found {num_anomalies} anomalies in the data. Please review the corresponding data points.”) else: print(“No anomalies detected. The data appears to be consistent.”) |
Note: In practice, you would need to adapt the code to your specific data, choose an appropriate algorithm, and consider more advanced data preprocessing and validation techniques.
Step 6: Dynamic updates
To keep your reports current and relevant, you want them to display real-time data. Here’s how to make this happen:
- Enable real-time data updates: Utilize AI to enable real-time data updates in your reports. For your e-commerce sales report, this means that the sales data is continuously updated, and your report dynamically reflects the most current sales figures. This ensures that stakeholders always have access to the latest information.
By following these steps and incorporating AI into your report-generation process, you can streamline operations, reduce errors, and ensure that your reports are always up-to-date and accurate. This allows you to focus your efforts on analyzing the data and making well-informed decisions, rather than expending time and effort on manual data retrieval and report creation.
Ready to transform your business with automated report generation? The future of data-driven decision-making awaits – take the first step now!